


I can see it’s useful, but at the end of the day, how exactly am I meant to say what it delivered?
It’s a question one hears rather often on the ground, whether supporting a generative-AI rollout or encouraging in-house adoption. Take, for instance, the case of Saeki (not their real name), who leads DX in the corporate planning division of a service company serving the manufacturing sector. Until six months ago, generative AI had spread through the workplace for drafting minutes, first drafts of proposals and initial responses to enquiries, yet the benefits remained stuck at qualitative impressions such as “it’s easier now” or “the quality feels more consistent.” The finance lead wanted firm grounds for the AI ROI calculation, the sales lead was cautious about claiming any AI contribution to revenue, and the team leaders on the ground were unsure how to measure the reduction in workload.
So Saeki’s team combined usage logs, work-time surveys, sampled evaluation of deliverables and A-tests of proposal wording, comparing the three months before the rollout with the three months after across four divisions and 186 tasks in total. The upshot: the average time to draft a set of minutes fell to roughly a third per item (for example, from 38 minutes to 14), and the rework rate at first review dropped from 22% to 13%. On revenue they sensibly stopped short of declaring that “generative AI alone drove the increase,” instead writing it up as an attribution exercise (a way of mapping which touchpoints influenced the outcome) against the opportunity-conversion rate and the number of proposals produced.
This article sets out how to design generative-AI measurement along three axes — reduced workload, improved AI quality and AI’s contribution to revenue — and how to explain it, with proper grounds, to leadership and outside stakeholders. The aim is a state in which investment decisions rest not on gut feel but on figures aligned for period, conditions and units. That said, measurement design alone cannot prove every benefit. Only when the way you take a baseline, your operating rules and the accuracy of on-the-ground input all line up do you arrive at effect-testing you can actually trust.
Generative-AI measurement rests on three axes: workload, quality and revenue
When explaining the results of a generative-AI rollout, the first thing to avoid is reporting on nothing more than “it’s become vaguely more convenient.” That impression matters on the ground, but it tends to fall short as grounds for a management decision or further investment.
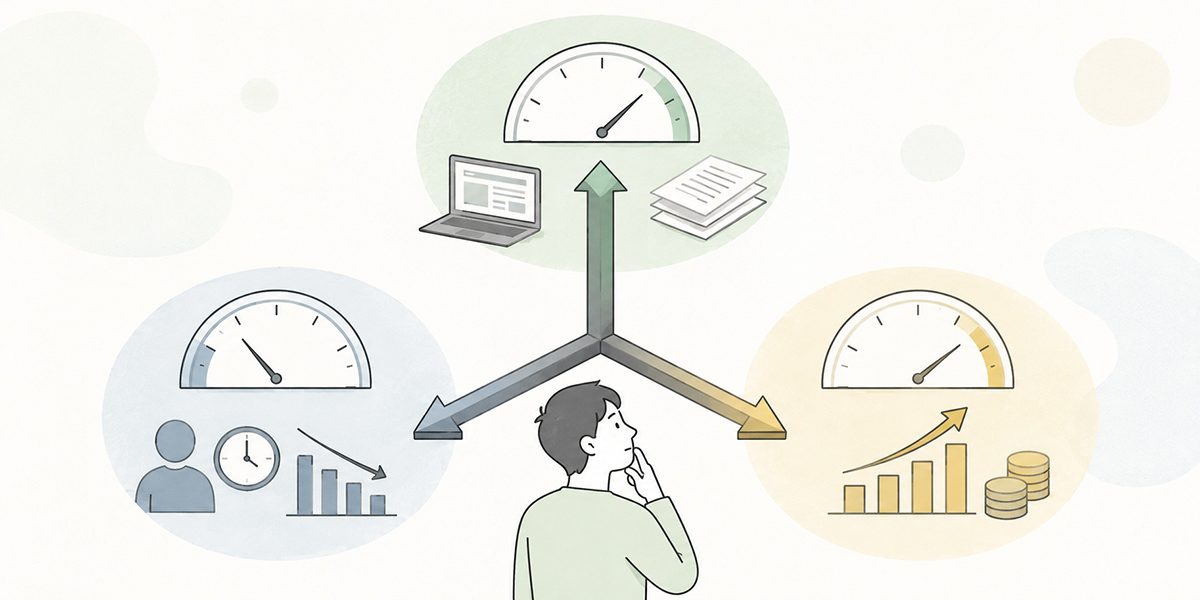
In generative-AI measurement, we begin by splitting the outcome into the following three axes.
- Reduced workload
- Verifying how much time has been shaved off work that people previously spent hours on — drafting minutes, composing emails, summarising documents, drafting responses to enquiries and the like.
- Improved quality
- The clarity of writing, variation in responses, the rework rate at review, missed items, inconsistent wording and the like — how the quality of deliverables and work processes has changed.
- Contribution to revenue
- Through the speed of drafting proposals, the quality of meeting preparation, more nurturing activity and improved sales materials, we look at how the indicators in the stage leading up to revenue have shifted.
If you blur these three together, measurement becomes vague. Put the story of shorter minutes-drafting time and the story of a higher conversion rate in the same table, for instance, and it becomes hard to tell where the direct effect ends and the indirect effect begins.
For that reason, start by separating “what this initiative can measure directly” from “what it may be influencing indirectly.” Reduced workload is relatively straightforward to present as a direct effect, whereas the contribution to revenue is also subject to the market climate, advertising budget, sales structure, product revisions and more. To avoid overstating generative AI’s effect, it is important to keep these measurement targets apart.
For measuring reduced workload, line up the baseline before the rollout
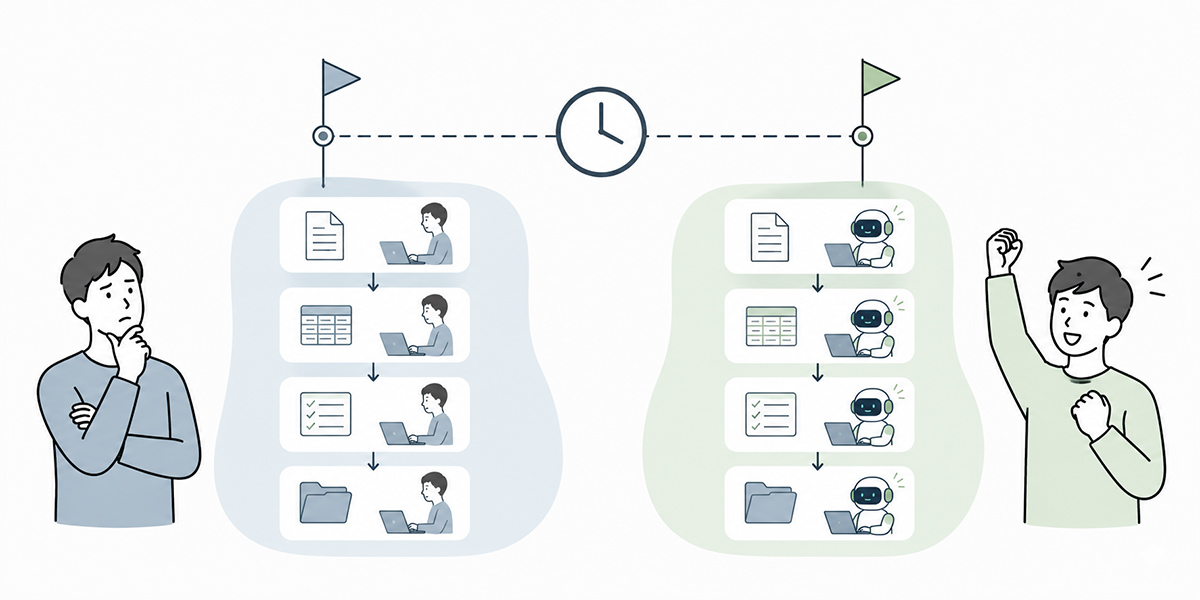
The single most important thing in measuring reduced workload is to capture the state of play before generative AI was introduced. This is what we call the baseline — the reference value against which an initiative’s effect is compared.
If, say, you are using generative AI to draft minutes, measuring only the post-rollout working time will not do. You need to have recorded, beforehand, how many minutes a single set of minutes took for the same kind of meeting.
Keep the measurement conditions as aligned as you can.
- Target task: drafting minutes for regular meetings
- Target period: three months before the rollout and three months after
- Volume: around 50 items in each period
- Unit of measurement: time to produce a single item
- Participants: staff in the same division, or in the same role
- Exclusions: unusually long meetings, special cases, meetings with faulty recordings and the like
The point to watch here is not simply to write “the time went down.” In the report, spelling out the conditions as below makes it far easier for the reader to verify.
Comparing 52 sets of regular-meeting minutes over the three months before the rollout with 54 of the same kind over the three months after, the average time to produce a single set fell from 38 minutes to 14.
Put this way, the period, the number of items and the unit are all clear. Should another division re-measure later, it is far easier to compare on the same terms.
If you are already using a generative-AI service, the usage logs from its chat and summarising features can serve as supporting data. Take, for example,Kanata, a service that lets you manage AI chat, AI summaries, prompts and training data on a per-project basis; with it, you can readily see which tasks AI was actually used on. That said, logs alone won’t tell you “how many minutes were genuinely saved.” You need to weigh them alongside work-time surveys, conversations with the staff involved, and the timestamps on submitted deliverables.
For improving AI quality, first decide what you mean by quality

The awkward part of measuring improved AI quality is that the word “quality” is simply too broad.
- The writing got better
- The answers improved
- The documents are easier to read
Such phrasing is natural enough as a felt impression on the ground, but for measurement it needs pinning down a notch further.
Quality indicators you can use for handling enquiries
If, for instance, you are using generative AI to handle enquiries, the quality indicators might include the following.
- Comprehensiveness of the first response
- Accuracy of the answer
- Consistency of tone
- Whether anything was missed
- Rate of items sent back at managerial review
- Satisfaction of customers or internal users
- Variation in answers from one staff member to another
Quality indicators you can use for drafting proposals
For drafting proposals, the following indicators come to mind.
- Number of typos and omissions
- Clarity of the structure
- How well it addresses the customer’s problem
- Number of review revisions
- Lead time from first draft to submitted version
- Number of statements requiring fact-checking
Measure quality by sampling
Trying to scrutinise every single item makes quality measurement a heavy operational burden. Sampled evaluation is therefore the sensible approach. Sampling means drawing a portion of the deliverables rather than all of them and checking that portion against the same evaluation criteria.
For example, draw 20 of the proposals produced each month and have two managers score them on the same evaluation sheet. Split the criteria into items such as “structure,” “fit with the customer’s problem,” “clarity of expression” and “presence of errors,” recording each on a five-point scale. Compare before and after the rollout and you can far more readily put a quantitative case for the improvement in AI quality.
For AI’s contribution to revenue, look at process indicators rather than revenue directly

A measure of caution is called for when explaining AI’s contribution to revenue.
Even if revenue rises after generative AI is introduced, one cannot put all of it down to the AI. Revenue is shaped by many things — the market climate, advertising budgets, sales headcount, product revisions, seasonal factors and so on.
It is therefore more realistic to view the contribution to revenue not as revenue directly but as the process indicators that lead to it. A process indicator is one that captures the actions or states along the way to the final outcome.
In marketing and sales, the following make likely candidates.
- Number of proposals produced
- Time spent preparing for meetings
- Time to reply to an email
- Number of white papers and articles produced
- Email reply rate
- Opportunity-conversion rate
- Win rate
- Number of lost-deal analyses
- Number of follow-up proposals to existing customers
If generative AI speeds up the first draft of a proposal, sales staff can more easily redirect time towards understanding the customer and preparing for the meeting. The upshot may be higher-quality meetings, with a knock-on effect on the conversion and win rates.
Even here, though, it is more honest to report “how the leading indicators that bear on revenue have shifted” than to declare flatly that “generative AI lifted revenue by X%.”
Weighing AI’s effect with an A-test
Running an A-test is another option. An A-test compares the results of different approaches with conditions held as alike as possible. For the same product and the same customer segment, say, you compare email copy drafted with AI against the conventional copy. Track open, click, reply and conversion rates over a set period and you can weigh AI’s effect rather more confidently.
In the report, frame this indirect contribution to revenue as an attribution exercise — that is, an account not of revenue itself but of which touchpoints on the way to revenue the AI had a hand in.
For the AI ROI calculation, make the scope of costs and effects explicit

When you carry out an AI ROI calculation, first decide what to count as “investment” and what as “effect.” ROI stands for return on investment.
Investment is more than the tool subscription. You need to weigh in the initial setup, in-house training, operating design, the time managers spend checking, prompt curation and the drafting of usage rules.
On the effect side, meanwhile, sit the time-value of reduced workload, the rework saved through better quality, the increase in sales activity, and more efficient handling of enquiries.
| Category | Examples of items to include |
|---|---|
| Investment | Tool subscription, initial setup, in-house training, operating design, time managers spend checking, prompt curation, drafting of usage rules |
| Effect | Time-value of reduced workload, rework saved through better quality, increased sales activity, more efficient handling of enquiries |
The basic idea runs as follows.
AI ROI = value of the effect from the generative-AI rollout ÷ amount invested in the generative-AI rollout
Suppose, for instance, that 300 hours of work a month are saved and the average labour cost of those involved works out at 4,000 yen an hour; the monthly saving is then 1.2 million yen. If the monthly investment — tool fees plus operating time combined — comes to 400,000 yen, the ROI is, on a simple reckoning, threefold.
So, for a leadership audience, rather than saying “labour costs fell,” it can sit closer to reality to explain that “there is scope to redirect 300 hours a month of working time towards higher-value work.”
In an AI ROI calculation, making the assumptions explicit matters more than making the numbers look large. In particular, spelling out the hourly rate, the number of people involved, the tasks in scope, the measurement period and any exclusions in the report makes it far easier to verify after the fact.
In the report, keep “what was confirmed” apart from “what is estimated”

When you write up the results of generative-AI measurement, structure it so the reader can readily form a judgement.
A structure we’d recommend runs as follows.
- The aim of the measurement
- Tasks and divisions in scope
- Measurement period and the basis of comparison
- Results on reduced workload
- Results on improved quality
- Leading indicators on the contribution to revenue
- Assumptions and results of the AI ROI calculation
- Comments from the ground
- Plans for further improvement
What matters most is keeping “what was confirmed” apart from “what remains an estimate.”
For example, that the working time fell from 38 minutes to 14 is, where the conditions line up, a direct effect that is comparatively easy to explain. The bearing on any rise in revenue, by contrast, should be treated as an estimate, since other factors are also in play.
In the report, separating the wording as below helps head off misunderstanding.
The shorter time to draft minutes was confirmed as a direct effect within the tasks in scope. The improvement in the conversion rate, on the other hand, is set out as an indirect contribution from AI use, since shorter proposal-preparation time and better content may also have played a part.
Writing it this way makes it easier to convey generative AI’s value while steering clear of overblown claims.
Measurement is not a one-off; put it to use in improving how you operate

Generative-AI measurement is not something you do just once, right after the rollout. Rather, it is something to use on an ongoing basis to improve how you operate.
Each month, say, you check usage, working time, the prompts in frequent use and any failures. Each quarter, you revisit quality evaluation, adoption by division, ROI and revenue-related indicators.
The wider generative-AI use spreads, the greater the variation in how individuals use it. One department may be seeing results in drafting minutes while another, its prompts unsettled, falls short of the hoped-for outcome. Measurement is useful for spotting precisely these differences.
Here, having a setup that organises usage logs, prompts, training data and deliverables by task makes the points for improvement easier to spot. You might combine existing BI tools, spreadsheets, a CRM and an internal portal, or you might use a service such asKanata, which organises AI use on a per-project basis. What matters is not the tool itself but building a way of working in which the measurement results feed back into the next round of improvement.
That said, too many measurement items only add to the burden on the ground. Rather than trying to build the perfect dashboard from the outset, the realistic course is to begin with a single task, a single division and a three-month comparison.
Don’t make measurement an end in itself: improve the prompts, revisit the training data, change what you teach, tidy up the usage rules. Only when it carries through that far does a generative-AI rollout take hold as genuine transformation of how work is done.
In closing: generative AI’s results can only be explained once you’ve decided how to measure them

Generative AI cannot, by mere introduction, explain its own results.
Even where it feels convenient on the ground, explaining it to leadership and to those outside the organisation calls for measurement designed along the three axes of reduced workload, improved quality and contribution to revenue.
For reduced workload, line up the baseline before and after the rollout. For improved AI quality, break quality down into evaluation items and check it by sampling. For AI’s contribution to revenue, look not at revenue itself but at process indicators such as the conversion rate and the number of proposals produced. And in the AI ROI calculation, make the scope of the investment and the effect explicit.
What matters is not making the numbers look large. It is being able to explain, over which period, in which task, under which conditions, what changed and by how much.
Generative-AI measurement is not merely an exercise in proving results. It is a shared language for revisiting how things are used on the ground and steering towards a way of working that delivers more.
Q&A: common questions on generative-AI measurement
Where should we start with generative-AI measurement?At first, we’d suggest narrowing it to a single task — “drafting minutes,” “first drafts of proposals” or “drafting responses to enquiries,” say, where it is easy to compare before and after the work. On that footing, line up the periods — three months before the rollout and three months after — and compare the time per item and the number of reviews.
When measuring reduced workload, are usage logs enough on their own?Usage logs alone fall short. They tell you “whether it was used,” but often not “how many minutes were saved.” Combine them with work-time surveys, conversations with the staff involved, the timestamps on submitted deliverables and the review history, and you get measurement that sits closer to reality.
How should we measure improved AI quality?Start by breaking “quality” down into evaluation items — accuracy, comprehensiveness, readability, inconsistent wording, rework rate, fit with the customer’s problem and so on. Where evaluating every item is impractical, draw a set number of deliverables each month and run a sampled evaluation on the same evaluation sheet.
Should AI’s contribution to revenue be measured by the revenue figure?Measuring it by the revenue figure alone warrants caution, since revenue is shaped by many factors — the market climate, the sales setup, advertising budgets, product revisions. The realistic first step is to look at the process indicators that lead to revenue: the number of proposals produced, meeting-preparation time, reply rate, conversion rate and win rate.
What is the single most important thing to watch in an AI ROI calculation?Not treating the time saved as a straight cut in labour costs. In practice the time saved is often redirected to other work. Rather than declaring in the report that “labour costs fell,” phrasing it as “there is scope to redirect X hours a month of working time towards higher-value work” sits closer to reality.