


We have handed out the accounts, but we honestly cannot tell who is actually using them.
At companies that have begun rolling generative AI out internally, this is the sort of remark you hear from the DX team, from IT, and from those running HR and training. A few months earlier the main job was to choose a tool, decide who would have access, run the training and distribute it across the business. Once the tool is in people’s hands, however, what you actually need is no longer “did we hand it out?” but a clear view of which departments are using it, for which tasks, how much, and what has changed as a result.
The people driving adoption want to see user numbers and login activity, yet staff on the ground are often left thinking, rather vaguely, “what should I even use this for?” Managers and senior leadership, meanwhile, will press for an account of the investment: time saved, faster handling of enquiries, better knowledge sharing. The trouble is that usage rates alone tell you nothing about impact, and chasing outcomes alone will never make the tool stick on the ground.
This article sets out how, during the early adoption phase of generative AI, you can design usage, scope of application and outcomes as KPIs, and tie them into a continuous improvement cycle. The ideal is a state in which you can see usage by department and by task, spot where people are stumbling, and feed that back into training, prompt libraries and operating rules.
That said, AI is no panacea. Simply setting KPIs will not make adoption happen; it is only when you combine metrics with hands-on support, sound information management and human review that you start to approach a repeatable way of working.
Why early-adoption KPIs matter for generative AI
“Deployed” and “actually used” are two different states
When you bring in a generative AI tool, the first numbers you see are the count of accounts issued and the number of people who attended training. Figures such as “we distributed accounts to 300 eligible staff” or “180 people attended the initial training” are perfectly useful for marking the start of adoption.
On their own, though, they tell you nothing about how the tool is really being used.
Some people may hold an account yet never log in. Others may have attended the training but, unsure how to apply it to their day-to-day work, have not touched it since. Conversely, certain departments may already have started using it for writing up minutes, drafting emails and handling internal enquiries.
In other words, in the early adoption of generative AI the first thing to confirm is not “did we hand it out?” but “is it actually being used?”.
Get a grip on usage behaviour before you talk about outcomes
Plenty of companies expect generative AI to cut working hours and lift productivity. But if you chase grand outcome metrics from the moment of go-live, you tend to open up a gap between yourself and the people on the ground.
Ask “how much cost have we saved?” a month in, say, and the answer is that staff may still be experimenting with how to use the thing. Generative AI does not deliver results the instant you hand someone the tool; it beds in gradually, as people find how it fits their work and as prompts and rules are tidied up.
For that reason, in the early phase it is important to get a grip on usage behaviour such as the following.
- Who is using it
- Which departments are using it
- Which features are being used
- Which tasks it is being used for
- How consistently people keep using it
Outcome KPIs matter, but as a precondition you need to design KPIs around usage behaviour first.
The numbers people want to see depend on where they sit
KPIs for generative AI adoption mean different things to different people.
Those driving adoption will want to see user numbers and how well it is taking hold by department. IT will want to confirm permissions management, usage rules and the security side of things. HR and training colleagues may want to know how much usage picked up after training, and which groups are struggling.
For staff on the ground, on the other hand, what matters is “has my job got easier?” and “is there any point in using this?”. Managers and leadership look to business improvement, return on investment and the knock-on effect across the organisation.
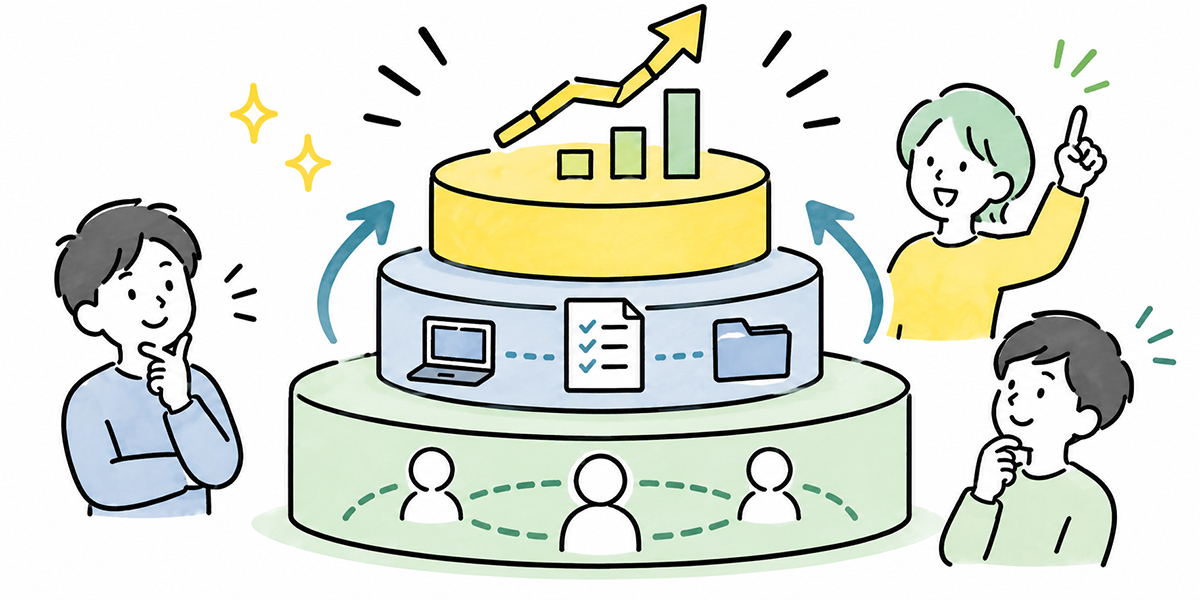
As this shows, a single number cannot capture KPIs for generative AI. By looking at usage, scope of application and outcomes separately, you can read the state of the organisation rather more accurately.
Think of early-adoption KPIs in three layers: usage, scope and outcomes
Usage KPIs: first, see whether it is being used at all
The first thing to look at is whether generative AI is actually being used.
Typical usage KPIs include the following.
| KPI | What it tells you |
|---|---|
| Accounts issued | The number of people able to use the tool |
| First-login rate | The share who actually logged in after distribution |
| Weekly active users | The number of people using it on an ongoing basis |
| Monthly active users | How well usage is taking hold overall |
| Uses per person | The spread in how often people use it |
| Uses by feature | What is being used — AI chat, summarising and so on |
Usage rates, though, are only the way in. A high number of uses does not necessarily translate into better work.
Someone may log in every day yet never reflect any of it in their actual output. Equally, someone who uses it only occasionally may be producing a great deal of value from a handful of important documents each month.
Treat usage KPIs, then, as a means of confirming whether the tool is being used, and read them alongside the scope-of-application and outcome KPIs discussed below.
Scope-of-application KPIs: see which tasks it is spreading to
The next thing to look at is which tasks generative AI is being used for.
In the early phase, it is all too easy to end up in a state where only a handful of more tech-savvy staff are using it. Usage rates rise even so, but you can hardly call that organisation-wide adoption.
Scope-of-application KPIs look at points such as the following.
| KPI | What it tells you |
|---|---|
| Users by department | Whether use is skewed towards particular departments |
| Usage by role | The differences between sales, back office, planning, HR and so on |
| Uses by task category | Which tasks it is being used for |
| Number of use cases | How widely the patterns of use are spreading |
| Template and prompt usage | Whether repeatable ways of using it are growing |
Break usage down by task category — minutes, email drafting, first-draft research, internal FAQs, training materials and the like — and the next area worth expanding into starts to become apparent.
The important thing is to find not merely “who uses it most” but “which tasks the people on the ground are most likely to accept it for”.
Outcome KPIs: see what changed in the work itself
Once usage and scope come into view, the next thing to consider is outcome KPIs.
Outcome KPIs look at what has changed in the work as a result of using generative AI. Typical examples are shorter task times, steadier quality, less rework and better knowledge sharing.
When you set outcome KPIs, however, you must always make the basis of the numbers explicit. Where the figures are not drawn from actual data, they should be treated as illustrative examples.
| Task | Illustrative outcome KPI |
|---|---|
| Writing minutes | Illustrative: time to write up minutes for a 60-minute meeting cut from 30 minutes to 10 per set |
| Handling internal enquiries | Illustrative: time to draft a first response cut from 15 minutes to 5 per enquiry |
| Producing training materials | Illustrative: time to produce a first draft of training materials cut from 3 hours to 1 per item |
| Writing emails | Illustrative: time to draft a routine external email cut from 10 minutes to 3 per message |
The crucial point here is not to let the numbers wander off on their own. Unless you set out the task in question, the comparison period, the sample size and the method of measurement, you will invite misunderstanding in management reports and internal briefings.
In the early phase, rigorous measurement of impact is sometimes simply not feasible. Where that is so, it is worth pairing the quantitative data with comments and use cases from the people doing the work.
Pitfalls to avoid when designing KPIs

Chasing the number of uses and nothing else
The most common pitfall is to chase the number of uses and nothing else.
The count of uses is easy to grasp and easy to put on a dashboard. On its own, however, it cannot tell you whether the use is “good” use.
If someone is asking the same question over and over, for instance, the count goes up, but that hardly means the work has become more efficient. If anything, it may mean they are floundering, unsure how to use the tool.
When you do look at the count of uses, confirm it alongside information such as the following.
- Which task it was used for
- Whether the output was actually used in the work
- Whether there was any change in task time or rework
- Whether the person keeps using it
- Whether the same use has spread to others
The count of uses matters, but it is the way in to understanding the state of things.
Demanding outcomes too soon
Generative AI adoption is a topic that readily draws the attention of senior leadership. As a result, those driving it can find themselves pressed for results at an early stage.
But if, straight after go-live, you ask only “how many hours have we saved?” and “what return on investment has it produced?”, you leave staff no room to experiment with how to use it.
In the early phase it is important to pick up small changes such as these first.
- The mental load of writing minutes has eased
- It has become easier to knock out a first draft of an email
- People can now organise their thinking before hunting through internal documents
- Drawing up an agenda before a meeting has become quicker
- The time to produce a first draft of training materials has come down
These may not show up as a great deal of ROI straight away. But they are what makes the people on the ground feel “this is something I can use”.
Outcome KPIs matter, but in the early phase, give priority to building up usage behaviour and small wins.
Applying the same KPIs to every department
How generative AI is used varies a great deal by department and by role.
In sales it might be used for tidying up meeting notes, drafting proposals and writing customer emails. In back-office functions the focus is likely to be searching regulations, handling internal enquiries and summarising minutes. In HR it may be used to put together training content and internal FAQs.
For all that, if the whole organisation looks only at “number of uses” across the board, you will misread how each department is really using the tool.
The sensible course is to separate organisation-wide KPIs from department-level ones.
| Type | Examples |
|---|---|
| Organisation-wide KPIs | Login rate, weekly active users, uses by feature, training completion rate |
| Department-level KPIs | Sales meeting notes tidied, HR training materials produced, back-office enquiries handled |
| Supporting outcome KPIs | Change in task time, amount of rework, user satisfaction, number of use cases |
By separating the numbers worth watching organisation-wide from those worth watching department by department, you arrive at an assessment that is rather closer to reality.
Practical steps for making generative AI usage visible
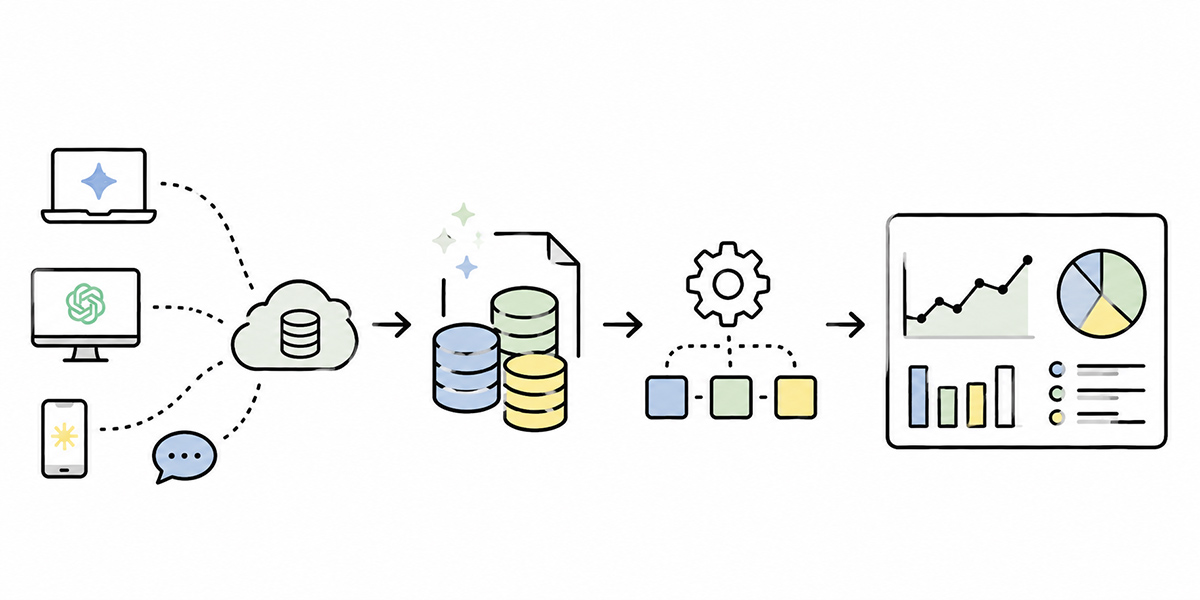
Decide the purpose and the target tasks
Before designing KPIs, first be clear about what you are using generative AI for.
Build KPIs while the purpose remains vague and you slide into a way of working that chases nothing but the count of uses. There is no need to cover every task from the outset. If anything, narrowing the target tasks makes impact easier to measure in the early phase.
Tasks that lend themselves to early adoption include, for example, the following.
- Writing up meeting minutes
- Drafting emails and chat messages
- First responses to internal enquiries
- First drafts of training materials and manuals
- Organising the key points of a research topic
- Tidying up weekly reports and one-to-one notes
These sit well with what generative AI is good at — writing, summarising and organising — and make sensible themes for early use.
Define the minimum set of things to measure
Next, define the items you will use to measure usage.
In the early phase there is no need to build an elaborate dashboard straight away. Start with basic items such as these.
| Item | What it covers |
|---|---|
| User | Who is using it |
| Department | Which departments and teams are using it |
| Feature | What was used — AI chat, AI summarising, learning support and so on |
| Task category | Minutes, email, research, handling enquiries and the like |
| Frequency | How much it was used weekly and monthly |
| Post-use rating | Whether it was helpful and usable in the work |
| Requests | Awkward points, templates people would like added and so on |
The important thing here is not to rely on log data alone. Logs may tell you the count of uses and which features were used, but not whether the tool actually helped the work.
Pair the logs with a short survey or a few interviews, then, and the story behind the numbers becomes a good deal easier to see.
Build dashboards you review weekly and monthly
The role of a KPI changes with how often you look at it.
Weekly, you check how usage is getting off the ground and any sudden shifts — whether users picked up after training, say, or whether only one department’s usage is climbing.
Monthly, you take a slightly wider view, checking how well usage is taking hold by department, the use cases and the improvement actions.
| Frequency | What to look at |
|---|---|
| Weekly | Active users, uses by feature, departments where usage rose or fell |
| Monthly | Usage trends by department, use cases, issues on the ground, improvement measures |
| Quarterly | Outcome metrics, progress on standardising work, a tidy-up for management reporting |
On a dashboard, rather than lining up numbers for their own sake, set out what the numbers have told you alongside the next action.
Do not stop at “sales uses it a lot”, for instance; tie it to an improvement such as “use is concentrated on tidying up meeting notes, so let us turn the successful prompts into templates”.
Feed KPIs back into training, rules and prompt improvements
KPIs are not something to look at merely for the sake of reporting. They are something to use for improvement.
If a department is using it little, for example, it may need training or a use-case showcase tailored to it. If usage is high but the outcomes are hard to see, the issue may lie in the quality of the prompts or in how the tool is built into the work.
Where there are prompts and templates that get a lot of use, tidy them up so the whole team can reuse them. Where, conversely, you find misuse or risky ways of working, revisit the operating rules and the information-management guidelines.
In the early adoption of generative AI, it matters to use KPIs for learning rather than for judgement.
A handy list of KPIs for early adoption
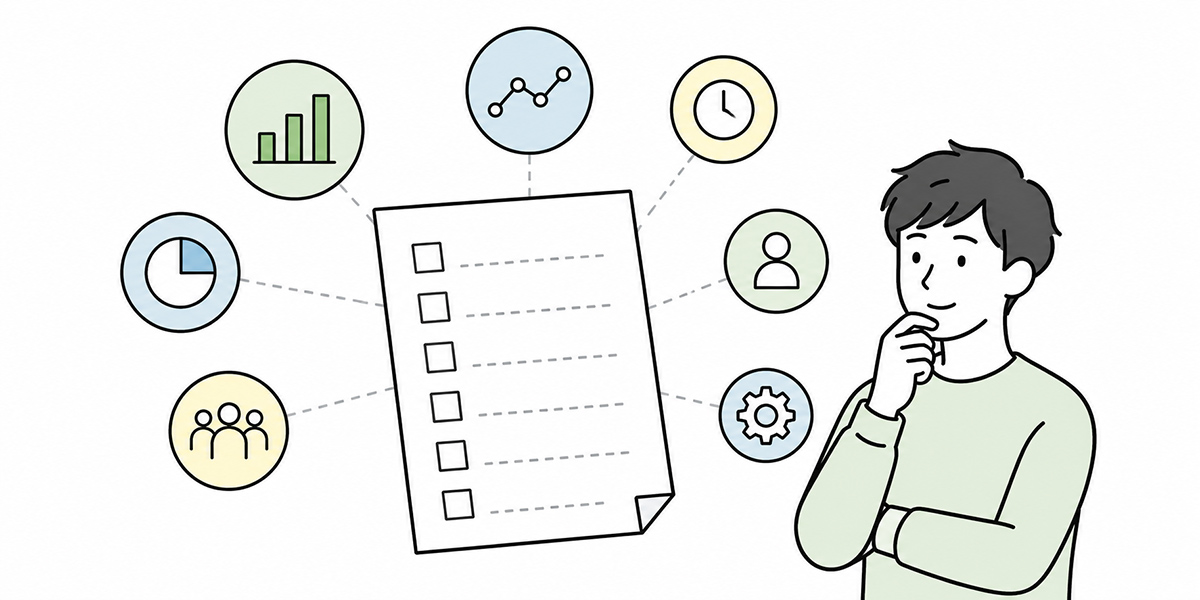
KPIs to watch organisation-wide
Organisation-wide KPIs are the metrics for checking how adoption as a whole is progressing.
| KPI | Description |
|---|---|
| Account-issuance rate | The share of eligible staff who are in a position to use it |
| First-login rate | The share who actually logged in after their account was issued |
| Weekly active user rate | The share of eligible staff who used it at least once a week |
| Monthly active user rate | The share of eligible staff who used it at least once a month |
| Training completion rate | The share of eligible staff who completed the initial training |
| Uses by feature | The count of uses for AI chat, summarising, learning support and so on |
| User satisfaction | The subjective rating from a user survey |
In the early phase, simply nailing down these alone makes the state of your rollout a good deal easier to read.
KPIs to watch by department
Department-level KPIs are designed to suit each function’s work.
| Department / role | Example KPIs |
|---|---|
| Sales | Meeting notes tidied, proposal drafts produced, email drafts used |
| Marketing | Article outlines produced, social post drafts produced, research notes tidied |
| HR | Training materials produced, internal FAQs produced, interview notes tidied |
| IT | Internal enquiries handled, manuals produced, knowledge searches |
| Managers | Meeting agendas produced, one-to-one prep, draft appraisal comments |
When you set department-level KPIs, it is important to confirm with the people on the ground that they match the reality of the work.
Decide the KPIs on the driving side alone and you can end up with numbers that mean nothing to the people doing the work.
Supporting metrics for explaining outcomes
Outcome KPIs become easier to explain when you pair the quantitative data with qualitative information.
| Supporting metric | What it tells you |
|---|---|
| Change in task time | Whether the time a particular task takes has changed |
| Amount of rework | Whether the number of corrections and checks has fallen |
| Knowledge-search time | Whether it now takes less time to find the information needed |
| Internal enquiries | Whether the burden of handling common questions has changed |
| Number of use cases | Whether there are more success stories worth rolling out to other departments |
| User comments | Whether the people on the ground feel they are getting value |
In the early phase in particular, you may not gather enough quantitative data. Where that is so, comments from the ground about which tasks it helped with, and how, become the material for the next stage of the rollout.
When choosing a tool, check how easy it is to measure and run
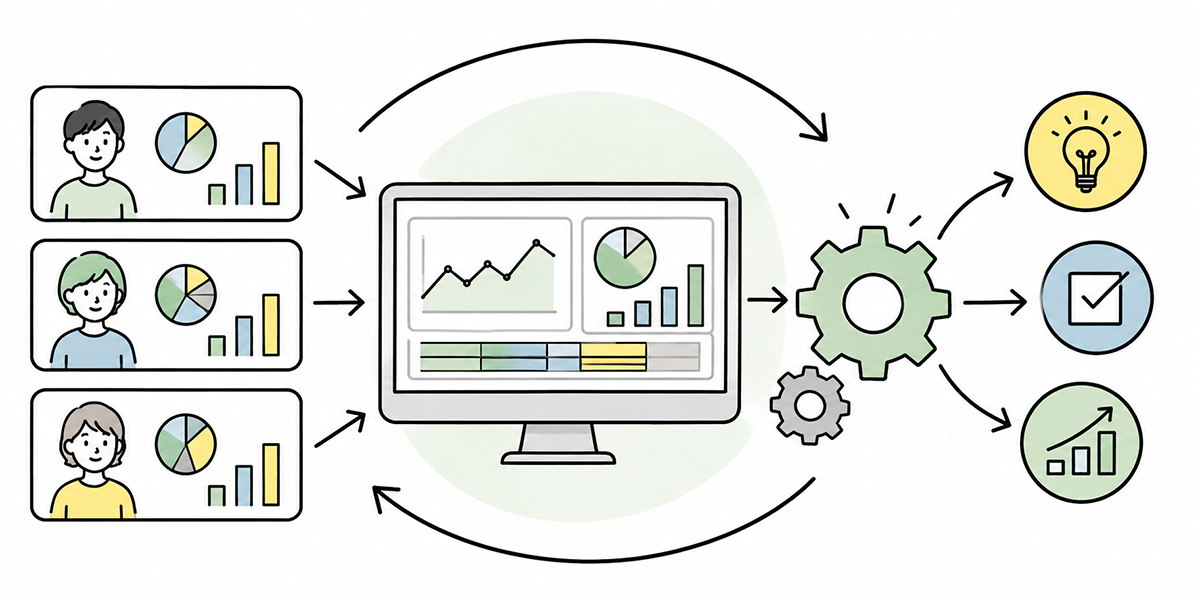
When you design KPIs for generative AI, how easy it is to measure and operate depends on which tool you use.
As a general rule, it is worth checking points such as these.
- Whether you can see usage by user and by department
- Whether you can separate the features and apps used by task
- Whether prompts and templates can be reused across a team
- Whether you can manage training data and reference material
- Whether permissions and information-management rules are easy to design
- Whether it fits neatly with training and an internal rollout
A service such as our own Kanata, for instance, which brings AI chat, AI summarising, e-learning and the like together in one place and lets you organise apps and members by project, makes it easier to keep track of usage by department and by task. Kanata offers work-support features such as AI chat, AI summarising and e-learning, built around the idea of adding apps within a project and running them there.
It also supports a way of working in which prompts you use repeatedly are stored in a prompt library, and material you reuse is stored in a training-data library.
That said, a tool’s features alone will not complete your KPI operation. Which metrics to watch, who reviews them and how you tie them to improvement actions all have to be designed on the organisation’s side.
Tying KPIs into the improvement cycle
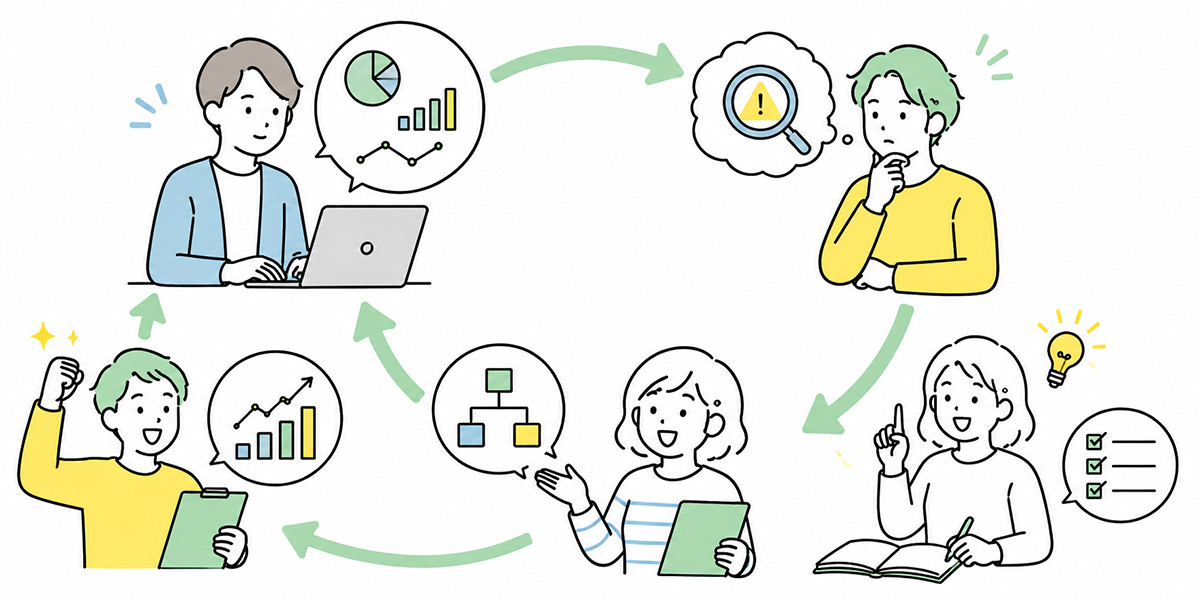
Do not let KPIs end at simply looking
Setting KPIs and merely looking at the numbers will not move adoption along.
What matters is to find the issues in the numbers and feed them into the next set of measures.
| What the KPI revealed | Next action |
|---|---|
| High login rate but little ongoing use | Add task-specific use-case training |
| Usage concentrated in one department | Share the success story with other departments |
| Heavy use of AI summarising alone | Standardise a minutes template |
| High usage but low satisfaction | Revisit the prompt examples and the how-to guide |
| Signs of incorrect use | Tighten up the information-management rules and the review setup |
KPIs should be used not to judge the people on the ground, but to find where to lend support.
Confirm the points to improve in a monthly review
In the early phase, setting aside a review roughly once a month makes the improvement cycle easier to turn.
In a monthly review, check points such as the following.
- Are users increasing?
- Are ongoing users increasing?
- Are there differences between departments?
- Is the range of tasks it is used for widening?
- Are there cases that can be used to explain outcomes?
- Are there features that go unused?
- Is there dissatisfaction or unease from the ground?
- Are there any information-management risks?
- Are prompts and templates being updated?
- What is the theme to improve next month?
It is effective to involve not only those driving adoption but also representatives from the ground and managers in this review.
By hearing the background the numbers cannot show from the people on the ground, you can make improvements that fit reality rather better.
Change KPIs as the phase changes
KPIs for generative AI need to change with the adoption phase.
In the first month, simply getting people started is what matters. In months two and three, you look at which tasks it is taking hold in. From month four onwards, you keep outcomes, standardisation and lateral rollout in mind.
The following are illustrative examples. In practice, adjust them to the number of people, the number of departments, the scope of work and the security requirements.
| Phase | Rough period | KPIs to emphasise |
|---|---|---|
| Getting started | Illustrative: month 1 | Account-issuance rate, first-login rate, training completion rate |
| Taking hold | Illustrative: months 2-3 | Weekly active rate, uses by task category, user satisfaction |
| Expanding use | Illustrative: months 4-6 | Usage by department, prompt reuse, number of use cases |
| Confirming outcomes | Illustrative: month 6 onwards | Change in task time, less rework, better knowledge sharing |
There is no need to build a finished set of KPIs from the outset. If anything, designing them on the assumption that you will revise them as you go produces metrics that suit the people on the ground rather better.
In summary: grow early-adoption KPIs from “was it used?” to “could we improve?”

Rolling generative AI out internally does not end with handing out the tool.
In the early phase, you first confirm whether it is being used. Next, you look at which departments and which tasks it is spreading to. Then you confirm whether it is feeding through into outcomes such as shorter task times, steadier quality and better knowledge sharing.
Set out like this, this flow falls into three layers.
- Usage: who is using it, and how much
- Scope of application: which departments and tasks it is spreading to
- Outcomes: what has changed in the work
That said, AI is no panacea. A rising usage rate for generative AI will not, by itself, lift the organisation’s productivity. It is only with use cases that fit the work on the ground, usable prompts, information-management rules, human review and continuous improvement that adoption truly beds in.
KPIs are not there merely to manage the people on the ground. They are there to find where people are stumbling, to judge which success stories to spread, and to feed into the next round of improvement.
In the early adoption of generative AI, rather than building perfect metrics from the outset, it matters to start simple and grow them alongside the voices of the people doing the work.
Q&A: common questions on generative AI usage and KPI design
Right after introducing generative AI, what should we make our KPIs first?
To begin with, it is realistic to start with KPIs that capture the state of getting going: account-issuance rate, first-login rate, weekly active user rate, training completion rate and the like. Chase cost-effectiveness alone too soon and you risk failing to assess fairly a situation in which staff are still at the experimental stage.
If the usage rate is high, can we say generative AI adoption is a success?
A high usage rate is a good sign, but it does not on its own amount to success. You also need to see which tasks it is used for, whether the output is feeding into actual deliverables, and whether there is any change in task time or quality. Usage rate is, after all, the way in to understanding the state of adoption.
What sorts of outcome KPIs are there?
Typical outcome KPIs include shorter task times, less rework, faster handling of enquiries, less time spent searching for knowledge, and shorter first-draft times for documents. When you put a number on these, however, you must make the task in question, the comparison period, the sample size and the method of measurement explicit.
Is it all right to vary the KPIs by department?
That is perfectly fine. If anything, splitting the KPIs to suit each department’s work makes the reality easier to grasp. In sales it might be tidying meeting notes and producing proposals; in HR, producing training materials and building FAQs; in IT, handling enquiries and producing manuals. Setting metrics that match the work is the way to go.
If adoption is not progressing even with KPIs set, what should we revisit?
First, confirm whether the purpose is clear and whether use cases that fit the work on the ground are being put forward. Then revisit the training content, the prompt examples, the templates, the information-management rules and the review setup. KPIs are a tool for moving adoption along; chasing the numbers alone will not lead to improvement.