

I can certainly feel that things have become easier, but the moment the board asks me how many hours we have actually saved, I am rather lost for an answer.
This is the situation faced by Yamaguchi (a pseudonym), who is driving generative AI adoption within a manufacturing company’s DX office, alongside colleagues in corporate planning, frontline management and the information systems department. Six months ago, the firm had begun using generative AI for tasks such as drafting meeting minutes, composing emails and handling internal FAQs. While the shop floor was happy to report that things felt quicker than before, nobody could say which tasks, for how many people, and how many hours had been saved, so measuring the effect of AI rested largely on gut feeling.
So they ran a comparison: time logs from the two weeks before adoption against the four weeks after, across three departments and 25 people, and set a baseline for five key tasks. Combining the usage history of AI chat and AI summarisation with a brief survey and a sampling study, they found that the weekly hours spent on the target tasks had shifted from a total of 312 hours to 246. That is a reduction of 66 hours, which, within the bounds of comparable conditions, they could now share on a dashboard as a roughly 21.2% cut in workload.
This article sets out a way of thinking about how to make generative-AI workload reduction visible, so that you can explain the gains in efficiency, and the ROI, to both leadership and the front line.The aim is not a vague sense that things have somehow got more convenient, but a state in which you can describe the improvement in terms of time, headcount and individual tasks. That said, visualisation alone will not make AI adoption stick. It is only when you run it alongside sound task design, clear input rules and regular review that you arrive at repeatable improvement. If this sounds familiar, do read on with your own operations in mind.
Why AI-driven workload reduction is so hard to visualise
In companies that have adopted generative AI, comments like “document drafting is faster”, “writing up minutes is far less of a chore” and “we get the first response out to enquiries more quickly” tend to surface fairly early on. Indeed, the OECD has noted that, while generative AI has the potential to reshape how work and organisations operate, its effects are by no means uniform.
The trouble starts the moment you try to explain those effects to leadership or to another department.
- The tool is being used happily on the front line, but nobody knows how much time has been saved
- You can count how often the AI is used, but you cannot judge whether it has genuinely improved efficiency
- A handful of staff are producing results, but you cannot frame it as an effect across the whole organisation
- When asked about ROI, you cannot put a number on the return relative to the investment
The root of this is that the benefit of generative AI tends to land not on the task as a whole but on a few of the steps that make up the task.
Take minute-taking. Suppose AI summarisation shortens the write-up of a 60-minute meeting from 30 minutes to 10. In practice, however, you are still left with preparing the recording, checking the summary, polishing the wording and sharing it with the relevant people.
In other words, what AI reduces is often not the whole task but a few of its steps: drafting, summarising, classifying, formatting and assisting with checks.
For that reason, measuring the effect of generative AI is not simply a matter of whether AI was used, but of seeing which task, at which step, saw how much time saved.
Treat being more convenient and having reduced the workload as separate ideas
In the early stages of AI adoption, what the front line actually feels matters first and foremost.
- It is easy to use
- The work goes faster
- It gives me a first draft to work from, which is a real help
Comments like these are a sign that adoption is moving in the right direction. When it comes to measurement, however, impressions alone do not amount to an explanation.
The reason is that being more convenient and having reduced the workload are two different measures.
Suppose an employee uses AI chat to draft an email. They themselves may find it convenient, yet you can still run into cases like these:
- The drafting got faster, but checking now takes longer
- They went back and forth with the AI so many times that, on balance, little time was actually saved
- Quality improved, but the time spent did not change
- Time was saved, but the saving simply migrated into another checking task
Quality gains and a lighter psychological load are, of course, valuable effects in their own right. But when you want to present something as workload reduction, you need to bring it down to time, headcount, number of cases and the like.
It therefore helps to sort the effects of AI adoption broadly into two:
- Quantitative effects
- Effects you can express in numbers, such as shorter task times, more cases handled, reduced lead times and lower outsourcing costs.
- Qualitative effects
- Effects that are hard to capture in numbers alone, such as better-written copy, steadier first responses, less reliance on particular individuals and a lighter psychological burden on staff.
Leadership tends to want quantitative effects, while for the front line the qualitative ones matter too. Showing both, kept distinct, rather than one to the exclusion of the other, is what counts when measuring the effect of generative AI.
Before you visualise workload reduction, narrow what you measure
When trying to visualise the workload reduction from generative AI, there is a temptation to measure usage across the entire company from the outset.
In the early stages, though, that is not something I would recommend.
If the scope is too broad, the tasks and the ways the tool is used vary so widely that you lose sight of what you are actually comparing. The realistic approach is to start with tasks where the effect is easy to produce and easy to measure.
Tasks well suited to measurement tend to have these features:
- They are carried out frequently
- The procedure is reasonably well defined
- They are easy to compare before and after AI use
- The time taken is easy to record
- Several people do much the same task
For example, the following tasks lend themselves well to early measurement:
- Drafting meeting minutes
- Drafting emails and chat messages
- Handling internal FAQs
- Summarising documents
- Producing first drafts of proposals and reports
- Summarising training material
- Assisting with routine report writing
By contrast, work such as planning, executive judgement, management and high-level customer negotiation is hard to assess through workload reduction alone. Rather than time saved, you need to look at qualitative effects too: better-organised options, fewer gaps in the argument, and higher-quality decisions.
The pragmatic path is to begin with the tasks that are easy to measure, then extend the measurement method you develop there to other tasks.
Set a baseline
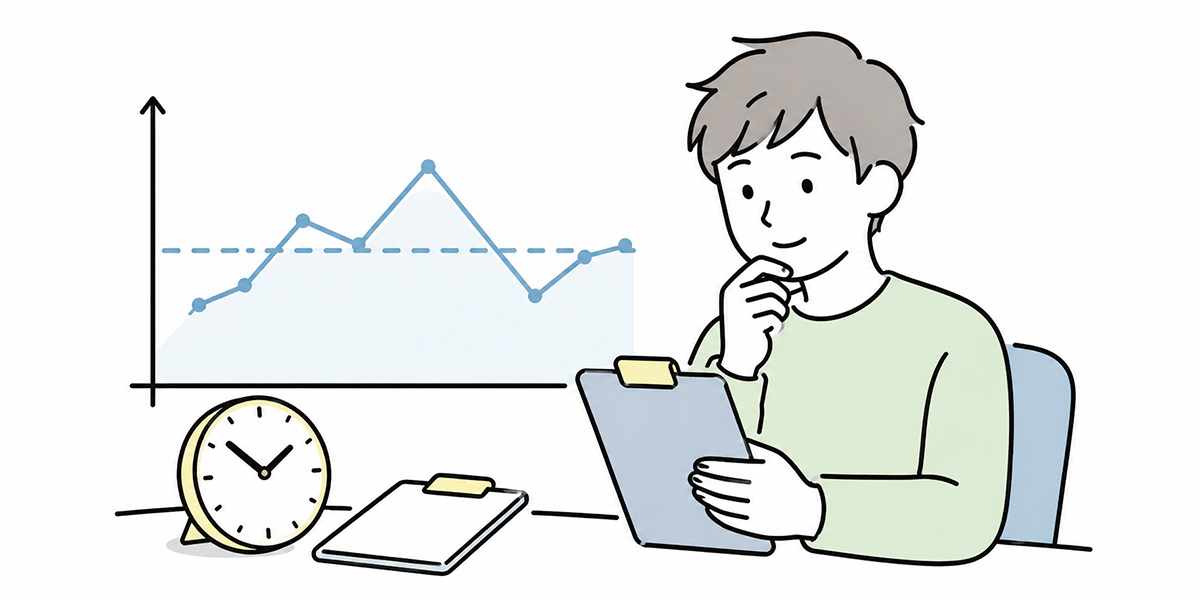
The single most important thing in visualising workload reduction is the baseline.
A baseline is the standard amount of time or work a task took before you used AI. Without it, you can say it feels faster after adoption, but you cannot say how many hours you have saved.
If you are measuring the workload of minute-taking, for instance, you would record the pre-adoption position like this:
- Time to write up the minutes for one 60-minute meeting
- Number of meetings per week
- Number of people responsible for the minutes
- Time spent checking and amending
- Lead time until the minutes are shared with the relevant people
As you can see, you record not just the raw task time but the surrounding work as well.
There are broadly three ways to set a baseline.
Measure directly with a time log
The most straightforward method is to record the time spent on the target task.
For example, you might ask participants to keep a time log for just two weeks. If recording in fine detail every day is too much, simply entering how many minutes they spent on the target task at the end of each day is perfectly acceptable.
That said, time logs tend to place a burden on the front line. If you insist on rigour from the start, the recording itself will not last.
In the early stages, then, a light-touch record like the following is quite enough:
- Record in 15-minute units
- Limit the target tasks to about five
- Limit the recording period to roughly two weeks
- Make clear that it will not be used for individual appraisal
The point is not to gather perfect data, but to create a reference figure good enough to compare against.
Measure by sampling
Where measuring everyone and every task is difficult, sampling is effective.
For instance, rather than the whole sales department, you take just the five members of the sales-planning team. Rather than all document preparation, you take only the weekly report.
With sampling, in exchange for narrowing the scope, it is important to make the conditions explicit.
For five members of the sales-planning team, over the two weeks from 1 to 14 April 2026, record the time spent producing the weekly report in 15-minute units.
By spelling out the participants, period, task and recording unit in this way, you make it far easier to explain later.
Supplement with a survey
Information that time logs and sampling cannot capture can be filled in with a survey.
For example, questions such as these:
- Before using AI, how many minutes did this task take on average?
- After using AI, how many minutes does this task take on average?
- Which part of the work is where the time has been saved?
- Is there any extra time spent checking the AI output?
- Has anything improved in terms of quality?
- Conversely, has anything become more of a chore?
Because surveys involve a degree of subjectivity, they make a weak basis on their own. Combined with time logs and usage history, however, they let you give an explanation that rings true on the ground.
Presenting it as, say, the time log shows 66 hours saved per week, and the survey shows that 19 of 25 people reported a lighter load on the target tasks, conveys both the numbers and the lived reality.
Measure the effect after adopting AI
Once the baseline is set, the next step is to gather data after adopting AI.
What matters here is to keep the conditions before and after as alike as you can.
If the before period was a normal stretch and the after period a busy one, you cannot simply compare them. Conversely, if the after period happened to be a quiet spell, you risk overstating the effect of AI.
When measuring, therefore, you make the following conditions explicit:
- The comparison periods
- The number of people covered
- The tasks covered
- The number of cases
- The measurement method
- Any factors excluded
The aim is to be able to write something like this:
Comparing 1 to 14 April 2026 as the before period with 1 to 28 May 2026 as the after period. The cohort was 25 people across three departments: sales planning, administration and the DX office. Five tasks (minute-taking, email drafting, document summarisation, internal FAQ handling and weekly report writing) were measured using a combination of time logs and a survey.
With conditions this clear, the numbers carry far more weight.
By contrast, phrases like it probably got faster or a lot of people feel the benefit make for thin material when it comes to executive or budget decisions. The further you extend the use of generative AI, the more important it becomes to make the measurement conditions explicit.
The basic formula for calculating workload reduction
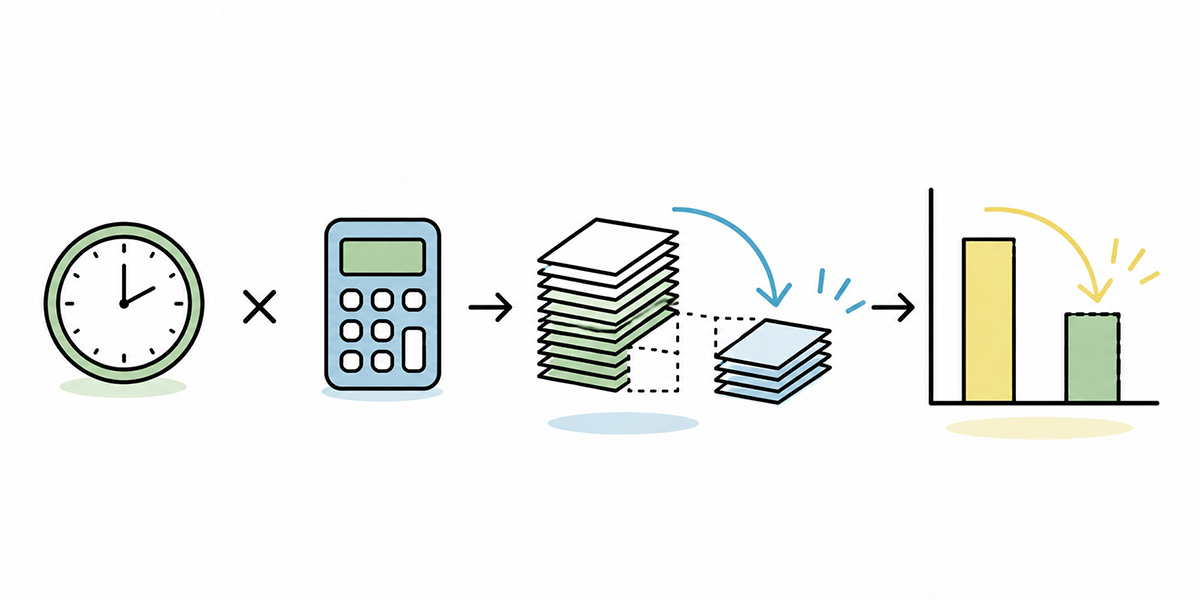
When visualising workload reduction, there is no need to begin with complicated sums.
Start with this formula:
Time saved = task time before AI − task time after AI
For instance, if minute-taking that used to take 30 minutes a time now takes 10 thanks to AI summarisation, the time saved per occasion is 20 minutes.
You then multiply this by the number of cases.
Monthly time saved = time saved per occasion × monthly number of cases
If there are, say, 60 sets of minutes a month, that is 20 minutes × 60 cases = 1,200 minutes, in other words 20 hours saved.
To extend this across more people or departments, you make the scope explicit and aggregate accordingly.
One word of caution, though: you should subtract the time spent checking the AI output.
For example, if AI shortens drafting by 20 minutes but adds 8 minutes of new checking, the genuine saving is 12 minutes.
In practice, then, it is realistic to think of it like this:
Net time saved = original task time − task time after AI − additional checking time
Building this in lets you measure the effect without overstating it.
The perspective you need to explain ROI
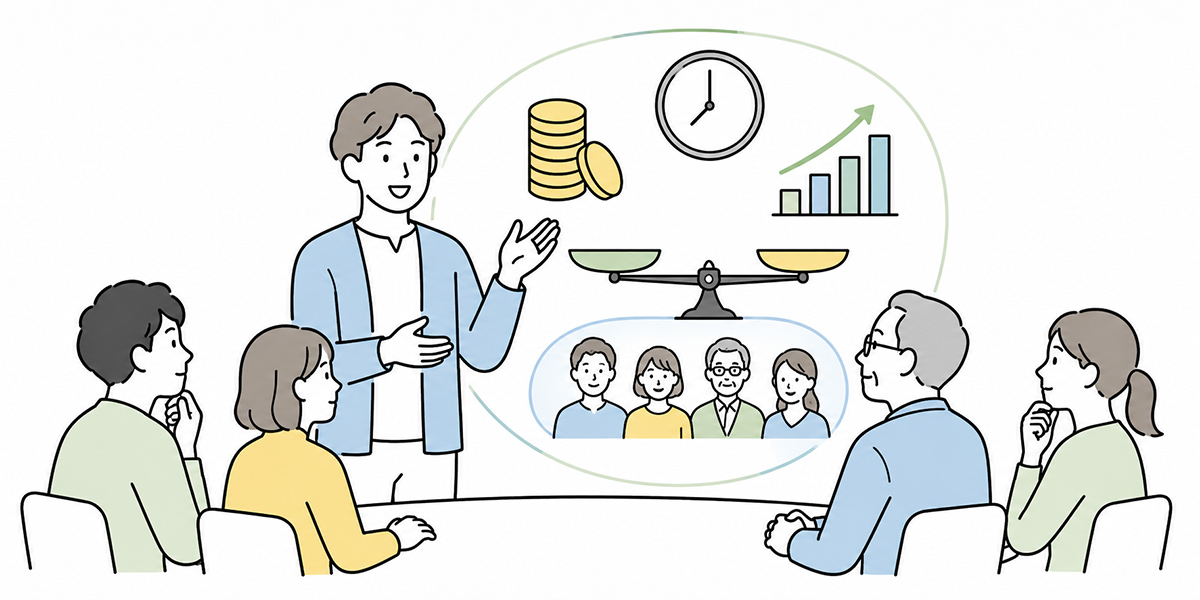
Once you can visualise workload reduction, the next question to come up is ROI.
ROI is a way of showing how much benefit you got for what you put in. In the case of AI, the investment includes tool costs, implementation support, training and the time spent on operational management.
The benefits, meanwhile, include the following:
- Time created through workload reduction
- Lower outsourcing costs
- More cases handled
- Shorter lead times
- Better quality
- Less reliance on particular individuals
- A lighter load on staff
Of these, the one easiest to put a number on first is workload reduction.
If, say, you can expect to save 100 hours a month, converting that time into labour cost makes the return on investment easier to explain.
Labour-cost conversion does need care, however.
Saving 100 hours does not necessarily mean a direct cut of 100 hours’ worth of pay. In most cases, the time saved is redirected to other work.
For that reason, it is also important to explain it not only as money saved but as time created.
By saving 100 hours a month, time that had gone into report and minute writing can now be redirected to customer engagement, planning initiatives and tidying up our knowledge base.
Framed this way, you can position AI adoption not as mere cost-cutting but as an investment in raising the quality of the work.
Data worth recording on your AI platform
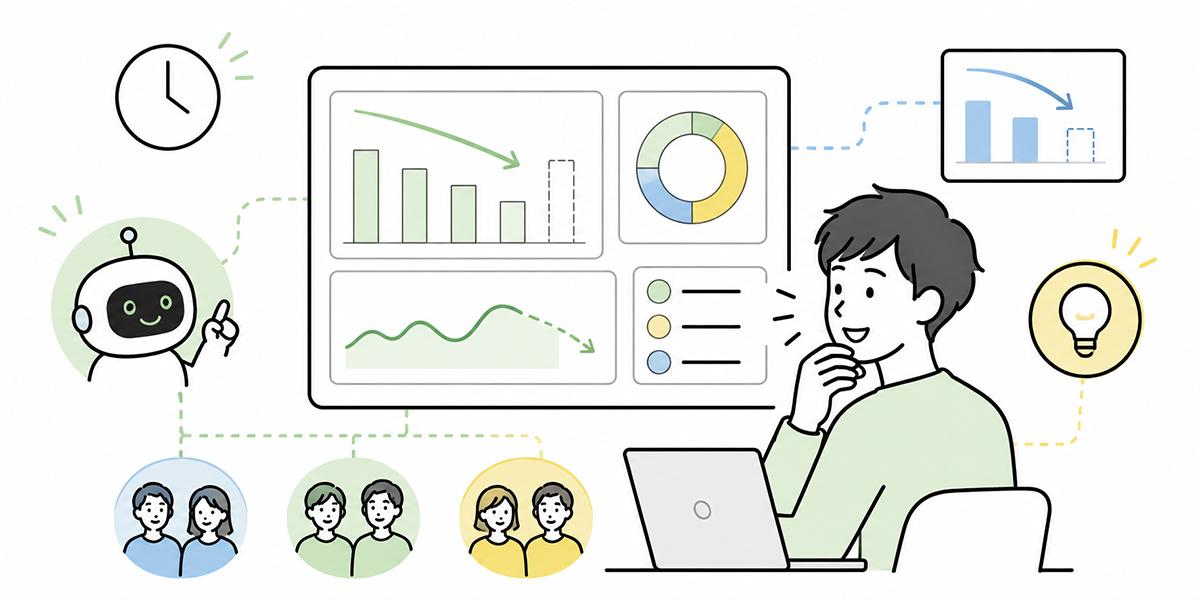
To keep an eye on AI-driven workload reduction over time, it helps to have an environment that records usage by task, not just individual impressions.
If, for example, you have a tool that lets you handle AI chat, AI summarisation, knowledge search and learning content by department or project, it becomes much easier to see which tasks the AI is being used for.
Even when you use a B2B AI platform such as Kanata, what you should look at is not mere usage counts. It is important to view the usage history of AI chat and AI summarisation alongside the target task, department, time saved, checking time and frontline assessment.
Recording data like the following, for instance, makes measurement easier:
- Which task it was used for
- How many times it was used
- How many minutes were saved per occasion
- How many minutes went into checking and amending
- Which department used it
- Whether users keep coming back to it
- What the front line makes of the output quality
What matters is not how many times the AI was used, but how it affected the time and quality of the work.
A high usage count that does not translate into workload reduction calls for improvement. Conversely, even modest usage may be judged highly effective if it sharply shortens the lead time of an important task.
What to watch on the dashboard
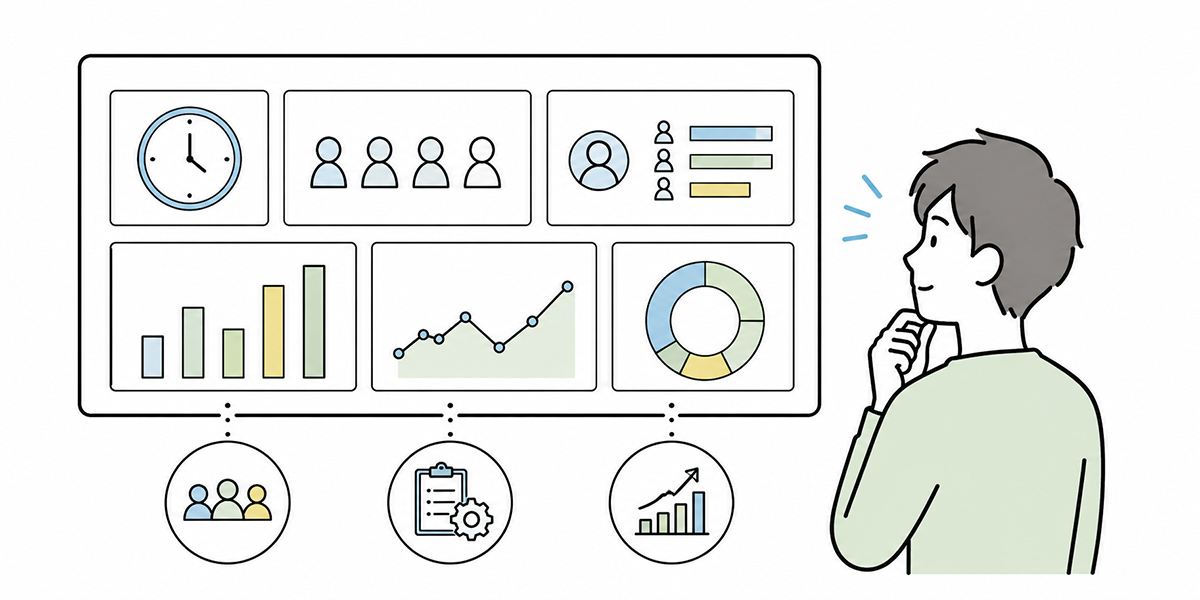
To manage workload reduction on an ongoing basis, building a dashboard is effective.
You need not build a complex dashboard from the outset, though. In the early stages, seeing the following five items is quite enough.
Time saved by target task
The first thing to look at is which task saved how many hours.
| Target task | Monthly workload before | Monthly workload after | Time saved |
|---|---|---|---|
| Minute-taking | 60 hours | 24 hours | 36 hours |
| Email drafting | 45 hours | 30 hours | 15 hours |
| Document summarisation | 40 hours | 22 hours | 18 hours |
| Internal FAQ handling | 50 hours | 38 hours | 12 hours |
Looking at it task by task like this shows you where the effect is coming through and where there is still room to improve.
Time saved by department
Next, look at the differences between departments.
Even with the same AI tool, the effect varies by department. Administration may see gains in minute-taking and internal enquiries, while sales may see them in email drafting and proposal writing.
Viewing it by department turns up hints for rolling things out more widely.
Number of users and retention
AI adoption cannot be called embedded just because something was used once.
You therefore need to watch not only the number of users but the retention rate.
If 100 people use it in the first month but only 20 the next, there is a problem with embedding it. On the other hand, even a small number of users can be analysed as a success pattern if a particular department keeps using it and is producing workload reduction.
What the saved time is used for
In explaining workload reduction, what the saved time was used for matters too.
Being able to show that the time was not simply freed up but redirected to more important work makes the value of AI adoption easier to convey.
For instance, you might ask in a survey:
- What did you use the time saved for?
- Used it for customer engagement
- Used it for planning and improvement work
- Used it for conversations with managers and team members
- It led to less overtime
- No clear change as yet
This item is useful for explaining things not just to leadership but to the front line as well.
Frontline satisfaction and concerns
Finally, check the voice of the front line.
Even where the numbers show a saving, you need to take care if the front line feels burdened. Checking AI output may be a chore, or writing prompts may be difficult.
For that reason, it is good to include qualitative comments on the dashboard, not just figures.
- Having a draft to start from has made things psychologically easier
- Summaries are handy, but checking proper nouns takes time
- We would like to share our most-used prompts across the team
Comments like these feed into the next round of improvement.
Common pitfalls
There are a few traps to watch for when visualising the workload reduction from generative AI.
Treating usage counts alone as the result
The most common mistake is to take AI usage counts and treat them, as they stand, as the result.
Usage counts are, of course, a useful guide to how well something has embedded. But a high usage count and genuine progress in efficiency are not the same thing.
What matters is the change in the work that lies beyond the usage count.
AI chat was used 1,000 times this month on its own is not enough. From there, you need to look through to which tasks it was used for, how much task time was saved, and what quality improvements followed.
Talking about the effect with no baseline
If you have not measured the task time before adoption, you cannot compare after adoption.
In that case, the explanation inevitably becomes it has got more convenient or it feels faster.
If you have already adopted AI and forgotten to capture a baseline, there is a way to build a rough reference figure after the fact using past work records and interviews.
If you do, though, it is important to label it clearly as an estimate based on interviews.
Over-extending a success story to the whole company
When one team produces a big result, it is tempting to extend it to the whole company in your explanation.
But if the tasks, the users’ skills and the state of the data differ, the same effect will not necessarily follow.
Even if the DX office achieves a 30% reduction, the sales or administration departments will not necessarily see the same.
Present a success story as a success story, and explain company-wide effects with the scope made clear.
Letting the measurement itself burden the front line
If you make the measurement too fine-grained, the front line will tire of the record-keeping.
It would be entirely self-defeating if, while trying to reduce workload with AI, you added new workload for the sake of measurement.
At first, it is best to narrow the target tasks and limit the recording period. Start at a level you can easily review monthly, and raise the precision of the measurement as needed.
Turning workload reduction into lasting practice
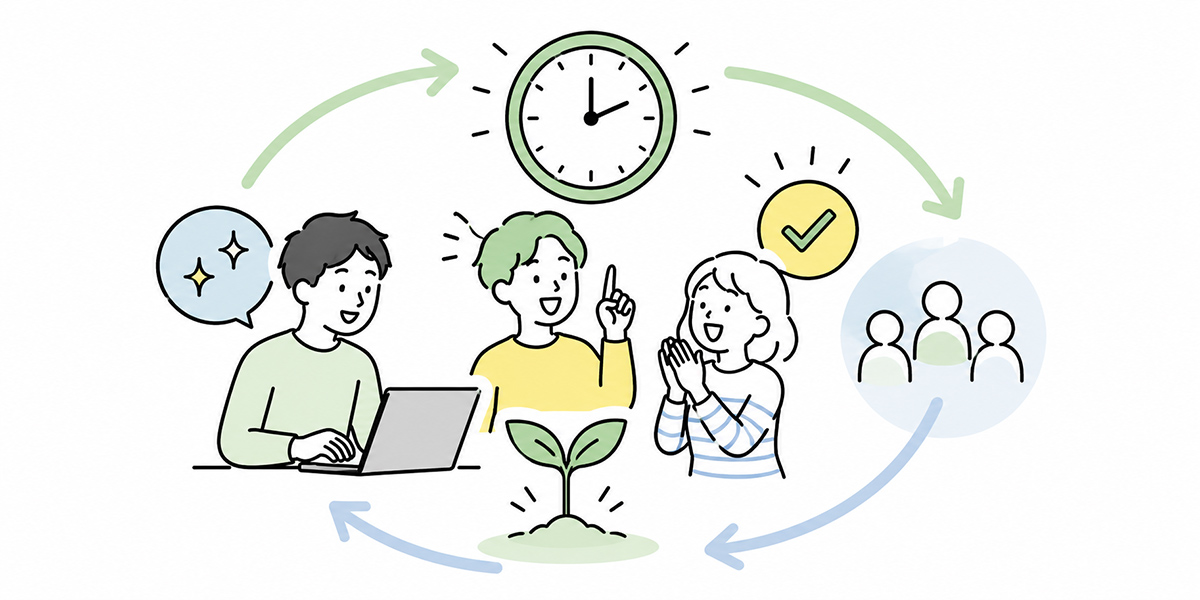
Visualising workload reduction is not the goal.
What matters is changing the way the work is done on the strength of what the visualisation reveals.
If minute-taking is producing a big effect, standardise a minutes template and roll it out across the company. If email drafting is working well, share the most-used prompts and refine them department by department. If internal FAQ handling is producing results, gather the questions that went unanswered and update the knowledge base.
In this way, measuring the effect becomes the starting point for a cycle of improvement.
My recommendation is to check these four points each month:
- Which tasks produced a saving
- Which tasks are not producing an effect
- What the front line finds awkward to use
- Which prompts or operating rules to improve next month
AI adoption is not something that is finished the instant you introduce it. By adjusting how you use it to suit the work, and improving while watching the data, the results gradually settle into something stable.
In summary: the value of AI can only be shared once it is made measurable
Generative AI can be put to work making all sorts of tasks more efficient: minute-taking, email drafting, document summarisation, internal FAQ handling and more.
But to explain the benefit of adoption within the organisation, the feeling that it has got more convenient is not enough.
What matters is to visualise workload reduction in the following sequence:
- Narrow down the tasks to measure
- Set a baseline before adoption
- Measure the task time after adoption
- Calculate the net time saved, including the additional checking time
- Share it on a dashboard by department and by task
- Combine the numbers with the voice of the front line to drive improvement
There is no need to aim for perfect measurement from the start. The important thing is first to trial it with a particular department, a particular task and a short period, and to gather data you can compare.
When using an AI platform too, you should look beyond mere usage counts to which tasks saw how much time saved and what improvements followed.
From somehow more convenient to being able to say which task generated how many hours of value.
That first step is the visualisation of workload reduction.
Q&A
Should generative-AI workload reduction be measured company-wide from the start?
There is no need to measure company-wide from the outset. If anything, narrowing the scope in the early stages makes for a more accurate comparison. Starting with, say, three departments, 20 to 30 people, five key tasks and a measurement window of two to four weeks lets you grasp the trend while keeping the burden on the front line down.
If there is no baseline, can you not measure the effect at all?
A rigorous comparison becomes difficult, but it is not the case that you cannot measure at all. You can build a rough estimate using past work records, the number of meetings, the number of documents submitted, interviews with the people responsible and surveys. In that case, though, you need to label it clearly not as a measured figure but as an estimate based on interviews.
Can AI usage count serve as a KPI?
Usage count can serve as a supporting indicator of how well something has embedded. On its own, however, it cannot tell you about workload reduction or gains in efficiency. If you do treat it as a KPI, it is important to combine it with the target task, time saved, checking time, retention rate, frontline satisfaction and the like.
When working out ROI, is it acceptable to convert to labour cost?
Labour-cost conversion is one method, but it needs to be handled with care, because saved time does not automatically translate into reduced labour cost. In most cases, the time saved is redirected to other work such as customer engagement, planning, improvement activities and training. So explaining it not only as money saved but as time created gives a truer picture.
In what situations does an AI platform such as Kanata help with measuring the effect?
It helps when you want to organise AI chat, AI summarisation, learning data and prompts by department or project. In particular, where several people use AI on the same task, such as minute-taking, document summarisation, internal FAQ handling and producing training content, combining usage history with task-level records makes workload reduction easier to visualise. That said, simply adopting a tool does not complete the measurement; you still need to design it together with the target tasks, the baseline, the checking time and the frontline assessment.